Housing desk / How the market works
What moves house prices
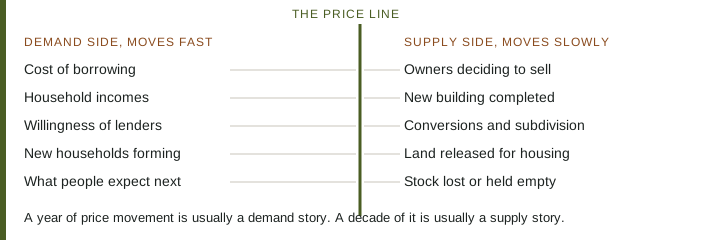
Price movements have two clocks. The fast one is demand, driven by what people can borrow and what they expect. The slow one is supply, driven by building, conversion and the release of land. Confusing the two is the most common error in housing conversation.
The cost of borrowing does most of the short-run work
Most homes are bought with borrowed money, and most buyers decide what they can pay by looking at the monthly figure rather than the total. When interest rates fall, the same monthly payment supports a larger loan, so the amount buyers can offer rises without anybody earning more. When rates rise, the process runs in reverse.
This is why price movements can look disconnected from the local economy. Nothing about the town has changed. The arithmetic of the loan has.
Incomes set the floor, and they move slowly
Over long periods, what people can pay for housing is bounded by what they earn, because a loan has to be serviced out of income. Rates can stretch or compress prices around that anchor for years at a time, but earnings determine where the anchor sits.
Local incomes matter more than national ones in most places, with the important exception of areas that draw buyers from elsewhere. Where a large share of purchases is made by people earning their money somewhere else, local earnings stop explaining local prices.
Credit conditions, which are not the same as interest rates
Even at a fixed rate, lenders can be more or less willing to lend: the deposit they require, how they treat variable income, how strictly they test whether a borrower could still pay at a higher rate, and how long a term they will allow. Loosening any of these adds buyers with money to spend. Tightening them removes buyers entirely.
Credit conditions tend to move in the same direction as sentiment, which amplifies both directions of travel.
Household formation, not population
Housing demand is counted in households, not people. A town whose population is flat can still need more homes if people are living alone for longer, separating more often, or staying in the area after leaving a family home. The reverse also happens: when costs rise, households merge, adult children stay put, and measured demand falls without anyone leaving.
Supply responds too slowly to rescue a shortage quickly
New building in any given year is a small fraction of existing stock, so even an unusually good building year barely changes the total. Land assembly, permission, infrastructure and construction take years, and by the time homes are finished the conditions that justified them may have gone.
The faster forms of supply are less visible: existing owners deciding this is the year to sell, large homes divided into flats, and buildings converted from other uses. In a rising market, the decision to sell is itself the main supply response.
Expectations, which are self-confirming for a while
If enough people believe prices will be higher next year, some buy sooner and some sellers hold out for more, and both behaviours push prices up in the short term. The belief is validated, which reinforces it.
This works until the arithmetic stops supporting it, usually because payments have grown faster than incomes, at which point the same mechanism runs backwards: buyers wait, sellers hold, sales volumes collapse and the market goes quiet rather than crashing loudly.
What to watch, in order
For the next twelve months, watch borrowing costs, lending criteria and the number of new listings. For the next ten years, watch building rates, land release, household formation and whether local employment holds up. Almost every confident forecast that fails has taken evidence from one clock and applied it to the other.